- Help & Support
-
 EN
EN
-

Location
United States of America

Trading Strategies
Harmonic Patterns Explained: A Complete Guide to Harmonic Trading Strategy
 2127
2127
 07-05-2026
By: Exclusive Markets
07-05-2026
By: Exclusive Markets
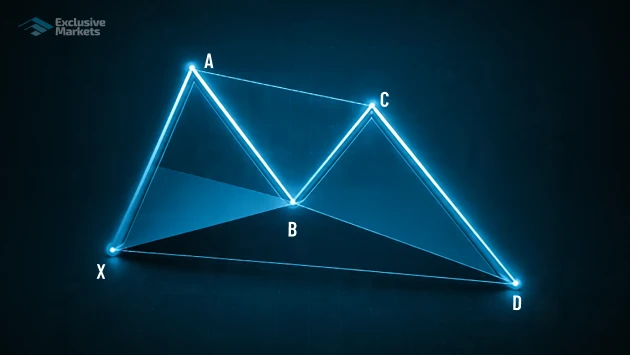
Table of Content
In financial markets, price charts often show more than just movement. They reflect how market participants respond to changing conditions. Traders use different analytical approaches to study these movements and identify where the price may potentially react next. Among these, harmonic patterns are widely recognised formations. Whether you’re a beginner or a more experienced trader, understanding how to identify them can support a more structured approach to analysing price action.
In this guide, we explore what harmonic patterns are, how these patterns work, types of harmonic patterns, how to recognise them on charts, and how they can be applied within a disciplined trading approach.
What Are Harmonic Patterns?
Harmonic patterns are advanced chart formations used to identify potential reversal points in the market. Unlike many traditional forex chart patterns that rely primarily on shape or visual structure, harmonic patterns are built on precise Fibonacci trading ratios, which define how the price moves from one point to another.
These patterns follow a specific structure, commonly referred to as the X-A-B-C-D formation, where each leg of the move is measured using Fibonacci retracements and extensions. The idea is not to predict exact market outcomes, but to highlight areas where price may react, often referred to as a Potential Reversal Zone (PRZ).
How Do Harmonic Patterns Work?
Fundamentally, harmonic patterns work by identifying repeating price structures that align with Fibonacci ratios. These ratios, such as 38.2%, 50%, 61.8%, 78.6%, and extensions like 127% or 161.8%, are used to measure how far the price retraces or extends during each leg of the pattern.
The typical structure includes:
- XA: The initial price move
- AB: A retracement of XA
- BC: A move in the direction of XA
- CD: The final leg, completing the pattern
The completion of point D is particularly important, as this is where the Potential Reversal Zone (PRZ) forms. It is within this zone that traders look for signs of a potential reversal.
However, it is important to understand that harmonic patterns do not guarantee reversals. Instead, they highlight areas where market participants may begin to reassess price, leading to possible shifts in direction. This aligns with a broader principle in trading, focusing on probabilities rather than certainty.
Types of Harmonic Patterns
Each harmonic pattern follows the same structure, but the difference lies in the Fibonacci ratios between the legs. These differences determine how deep a retracement is, how far the price extends, and how strong a potential reversal might be.
While there are several variations, five of the most commonly used patterns in harmonic trading are:
Gartley Pattern
The Gartley pattern is one of the earliest and most widely recognised harmonic patterns. It is generally considered a retracement-based pattern, meaning price does not extend beyond the initial move (XA), but instead corrects within it.
The key characteristics of the Gartley harmonic pattern are:
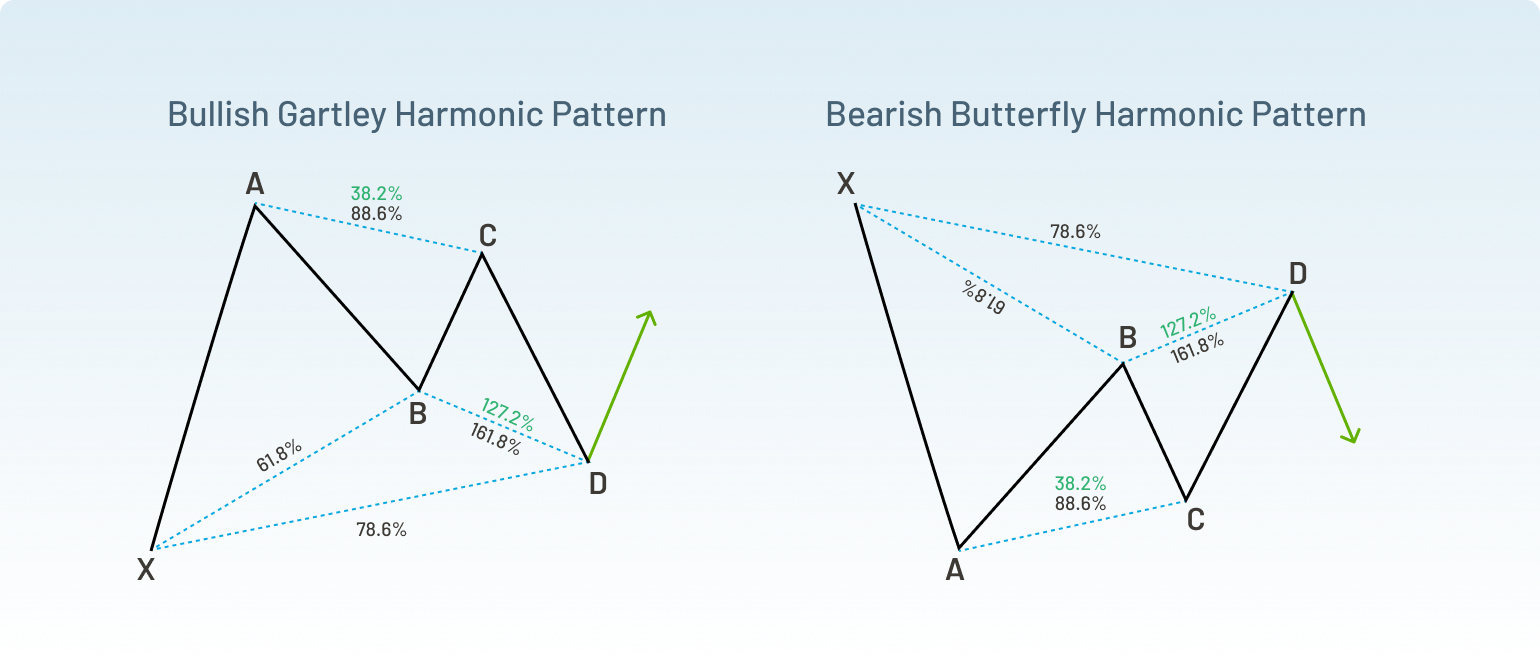
- B point retraces around 61.8% of XA
- D point completes near 78.6% of XA
- Price remains within the range of the initial XA move
- Structure often appears as an “M” (bearish) or “W” (bullish) formation
It typically appears during a trend and suggests a temporary correction before continuation. It is often seen as a more balanced and less aggressive setup compared to other harmonic patterns.
In practical terms, it can align well with a pullback trading strategy, as both focus on entering during retracements within a broader trend.
Butterfly Pattern
The Butterfly pattern is an extension-based harmonic pattern that typically forms after a strong price move. Unlike retracement patterns, the price in a Butterfly structure moves beyond the initial XA leg, making it more common near market extremes.
The key characteristics of the Butterfly harmonic pattern are:
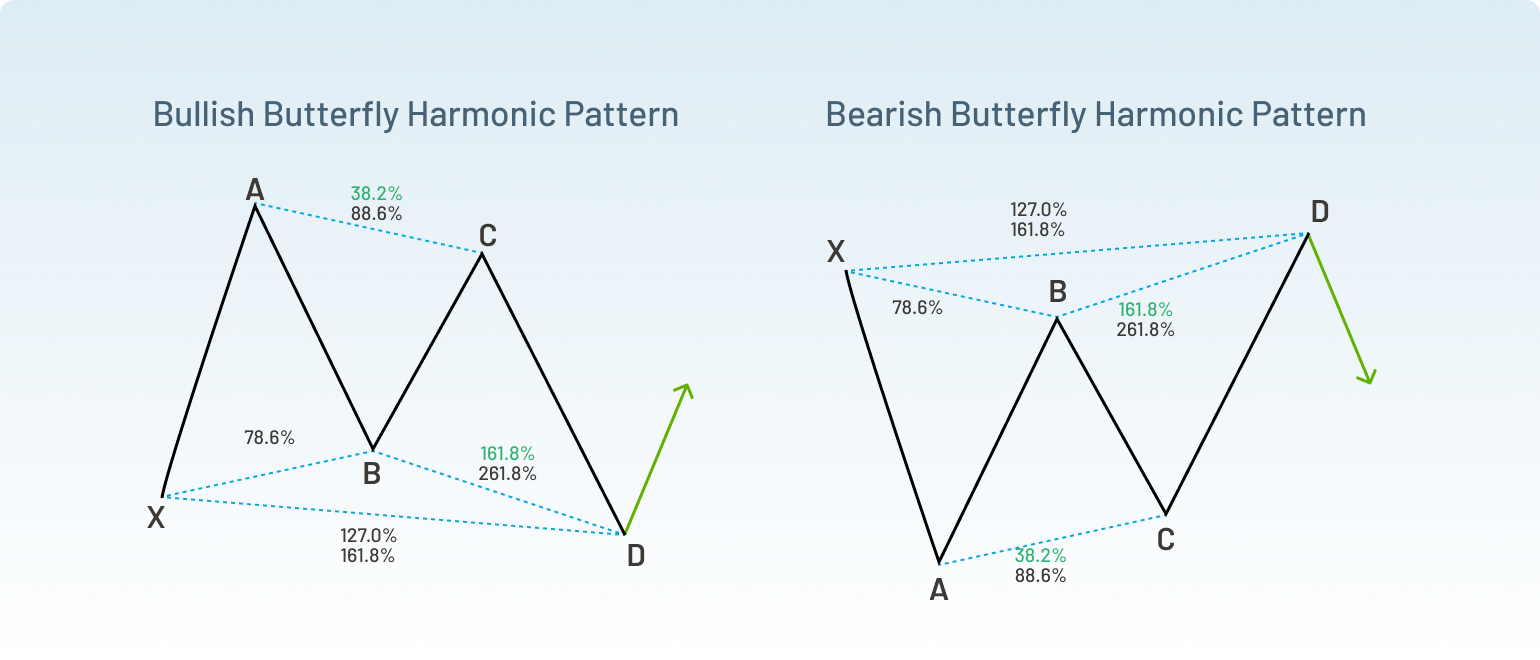
- B point retraces around 78.6% of XA
- D point extends to approximately 127%–161.8% of XA
- Price breaks past previous highs (bearish) or lows (bullish) before completing
The Butterfly pattern often signals that a trend may be approaching exhaustion. As price extends beyond prior levels, it can reflect a final push driven by momentum before a potential reversal develops.
Because of this extended structure, the pattern is typically observed near tops and bottoms, where the market may be overstretched. However, it is important to treat the completion point as a potential reversal zone (PRZ) rather than a guaranteed turning point.
Bat Pattern
The Bat pattern is known for its more measured and conservative structure, making it one of the more structured harmonic patterns. Compared to others, it forms with a shallower initial retracement and completes near a deeper, well-defined level.
The key characteristics of the Bat harmonic pattern are:
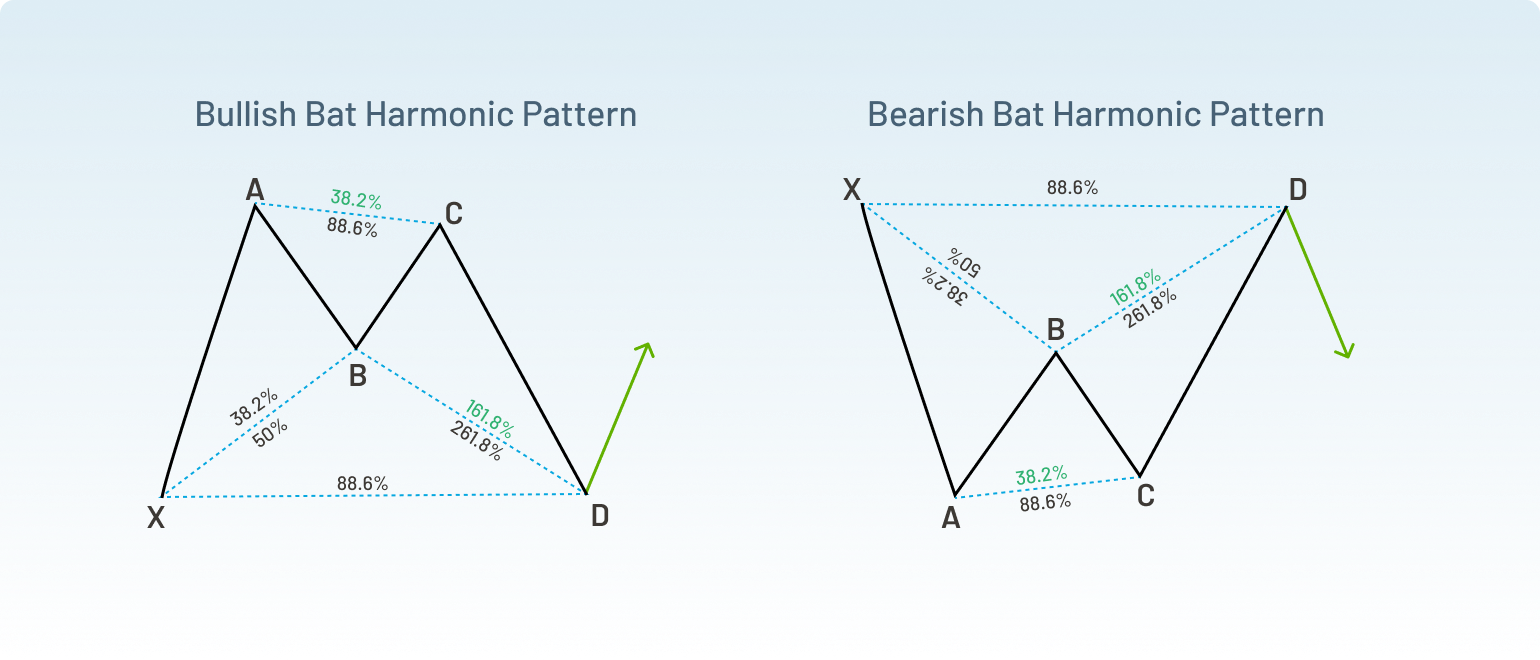
- B point retraces around 38.2%-50% of XA
- D point completes near 88.6% of XA
- Structure remains within the XA range (no major extension beyond it)
The Bat pattern reflects a controlled correction within an existing trend, rather than an overextended move. Because of its tighter structure, the Potential Reversal Zone (PRZ) is often more clearly defined.
This can make it particularly useful for traders who prioritise precision, as the pattern allows more structured planning around entry and stop placement.
The Bat pattern is often associated with strategies that emphasise risk management in forex, as the defined PRZ can support clearer risk parameters when combined with confirmation signals.
Crab Pattern
The Crab pattern is considered one of the more aggressive harmonic patterns, characterised by its deep price extension before completion. It often forms after strong, extended market moves.
The key characteristics of the Crab harmonic pattern are:
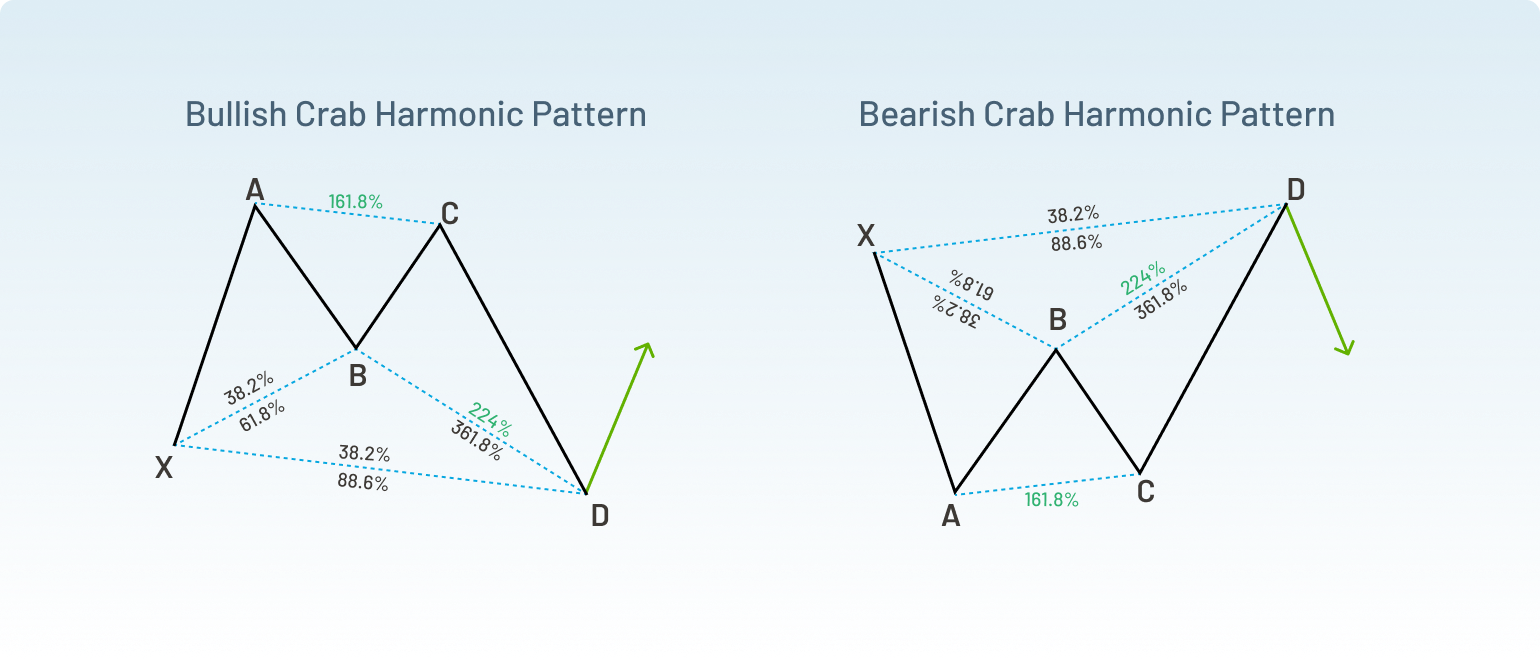
- B point typically retraces around 38.2%–61.8% of XA
- D point extends to approximately 161.8% of XA
- Price moves significantly beyond the initial XA leg before completion
The Crab pattern usually appears when the market is overextended, suggesting that the price may be approaching a potential exhaustion point. Because of this, it is often associated with sharp reactions near the Potential Reversal Zone (PRZ).
However, the extended nature of the move also means higher volatility and risk. Price can remain stretched for longer than expected, making patience and confirmation especially important.
AB=CD Pattern
The AB=CD pattern is one of the most fundamental harmonic structures and is often considered the building block of more complex patterns like the Gartley or Butterfly. It is based on the idea of price symmetry, where two price legs (AB and CD) are equal or closely aligned in length and time.
The key characteristics of the AB=CD harmonic pattern are:
- AB and CD legs are equal or nearly equal in length
- BC retraces typically around 61.8%–78.6% of AB
- CD extends from BC using Fibonacci projections (often 127% or 161.8%)
- Completion occurs at point D, forming the PRZ
The AB=CD pattern reflects a balanced market move, where price corrects and then resumes in a measured, symmetrical way. This symmetry is used to identify areas where the current move may be reaching completion.
Unlike more complex harmonic patterns, the AB=CD is relatively easier to identify, making it more accessible for traders who are newer to Fibonacci trading.
How to Identify Harmonic Patterns on Charts?
Recognising harmonic patterns on live charts requires a combination of structure, measurement, and patience. While the patterns may look complex at first, breaking them down into a repeatable process can make identification more manageable.
Here is a simple step-by-step guide on how to identify these patterns:
Step 1: Identify the Pattern Structure
Start by identifying a clear X-A-B-C-D formation on the chart.
Look for well-defined swing highs and lows rather than choppy price action.
At this stage:
- Mark key turning points
- Check if the structure resembles a known harmonic pattern
Avoid forcing a pattern where one does not clearly exist.
Step 2: Measure Fibonacci Ratios
Use Fibonacci tools to validate the structure:
- Measure AB retracement of XA
- Measure BC retracement of AB
- Project CD extension from BC
This is where harmonic trading becomes essential. Each harmonic pattern follows specific ratio guidelines, and alignment with these levels helps confirm whether the setup is valid.
Step 3: Define the Potential Reversal Zone (PRZ)
The PRZ is the area where the pattern completes (point D).
It is typically formed by:
- Fibonacci retracement of XA
- Fibonacci extension of BC
- Completion of AB=CD symmetry
This zone represents where the price may react, not a guaranteed reversal point.
Step 4: Wait for Confirmation
Avoid entering immediately at the PRZ.
Instead, look for confirmation such as:
- Rejection candles (e.g., pin bars, engulfing patterns)
- Break of short-term price structure
- Momentum signals using tools like the RSI indicator
This step helps reduce the likelihood of false entries.
Step 5: Enter the Trade
Once confirmation is present, some traders may consider positioning in the direction of the anticipated move, for example:
- Buy near bullish PRZ
- Sell near bearish PRZ
The focus is on structured participation, not perfect timing.
Step 6: Apply Risk Management
Even when a harmonic pattern completes at the PRZ, the reversal is not guaranteed. This makes risk management a key part of the strategy. Here is how risk can be managed around the reversal zone:
- Stop-loss: Typically placed slightly beyond the PRZ (beyond point D), where the pattern would be considered invalid
- Take-profit: Often based on prior structure levels (e.g., point B or C) or partial exits as price moves away from the reversal zone
- Position sizing: Adjusted to maintain consistent risk across trades
The objective is to define risk clearly while allowing the trade enough room to develop from the anticipated reversal area.
Step 7: Maintain a Disciplined Approach
Harmonic patterns require both precision and patience. Entering too early or ignoring pattern rules can reduce effectiveness.
This is where trading psychology plays a key role:
- Wait for the pattern to fully complete at point D
- Avoid anticipating reversals before confirmation
- Stay consistent with your rules, even if some setups do not work
Because harmonic pattern trading aims to identify potential reversal zones based on historical price structures, disciplined execution is essential. The focus should remain on well-defined setups rather than frequent trading.
How to Start Harmonic Trading?
To begin trading harmonic patterns, it’s important to approach the strategy with a structured and informed mindset. Rather than focusing only on pattern recognition, traders should aim to build a balanced understanding of how these setups fit within overall market conditions.
Start by familiarising yourself with the core principles of harmonic patterns, including how Fibonacci ratios define each structure and how Potential Reversal Zones (PRZs) are formed. This foundational knowledge helps in identifying patterns more accurately and avoiding common mistakes.
Next, define your trading approach. This may involve focusing on bullish setups, bearish setups, or both, depending on your strategy and the market conditions you are analysing. Having a clear directional bias based on structure and confirmation can support more consistent decision-making.
Once you are comfortable with the basics, you can consider opening a trading account with Exclusive Markets to explore this approach in real market conditions.
Conclusion
Markets rarely move in straight lines, and harmonic patterns aim to bring structure to those movements. By mapping price movements through measured patterns and Fibonacci relationships, traders can identify areas where market momentum may shift. However, these patterns are not signals of certainty, but frameworks for informed decision-making.
Combining them with confirmation, disciplined execution, and sound risk management remains essential. With time and consistency, harmonic patterns can become a valuable part of a well-rounded trading approach.
Are you Ready to Explore the World of Trading?
Disclaimer: The information provided on this blog is for educational/informational purposes only and should not be considered financial/investment advice. Trading carries a high level of risk, and you should only trade with capital you can afford to lose. Past performance is not indicative of future results. We do not guarantee the accuracy or completeness of the information presented, and we disclaim all liability for any losses incurred from reliance on this content.