- Help & Support
-
 EN
EN
-

Location
United States of America
Trading Strategies
Trend Trading Strategy: How to Identify Trend and Trade?
 2129
2129
 05-02-2026
By: Exclusive Markets
05-02-2026
By: Exclusive Markets
Table of Content
Every market moves in patterns, sometimes steadily upward, sometimes sharply downward, and at times, it simply drifts sideways. Understanding and observing these market directions forms the foundation of trend trading, a trading approach used in various markets but not suitable for all investors.
For traders, especially beginners, understanding trends may provide structure and discipline in trading decisions, although outcomes can vary depending on market conditions and individual experience. In this guide, we’ll explore what trend trading really means, how traders identify trends, and the types of trend trading strategies they often use.
What is Trend Trading?
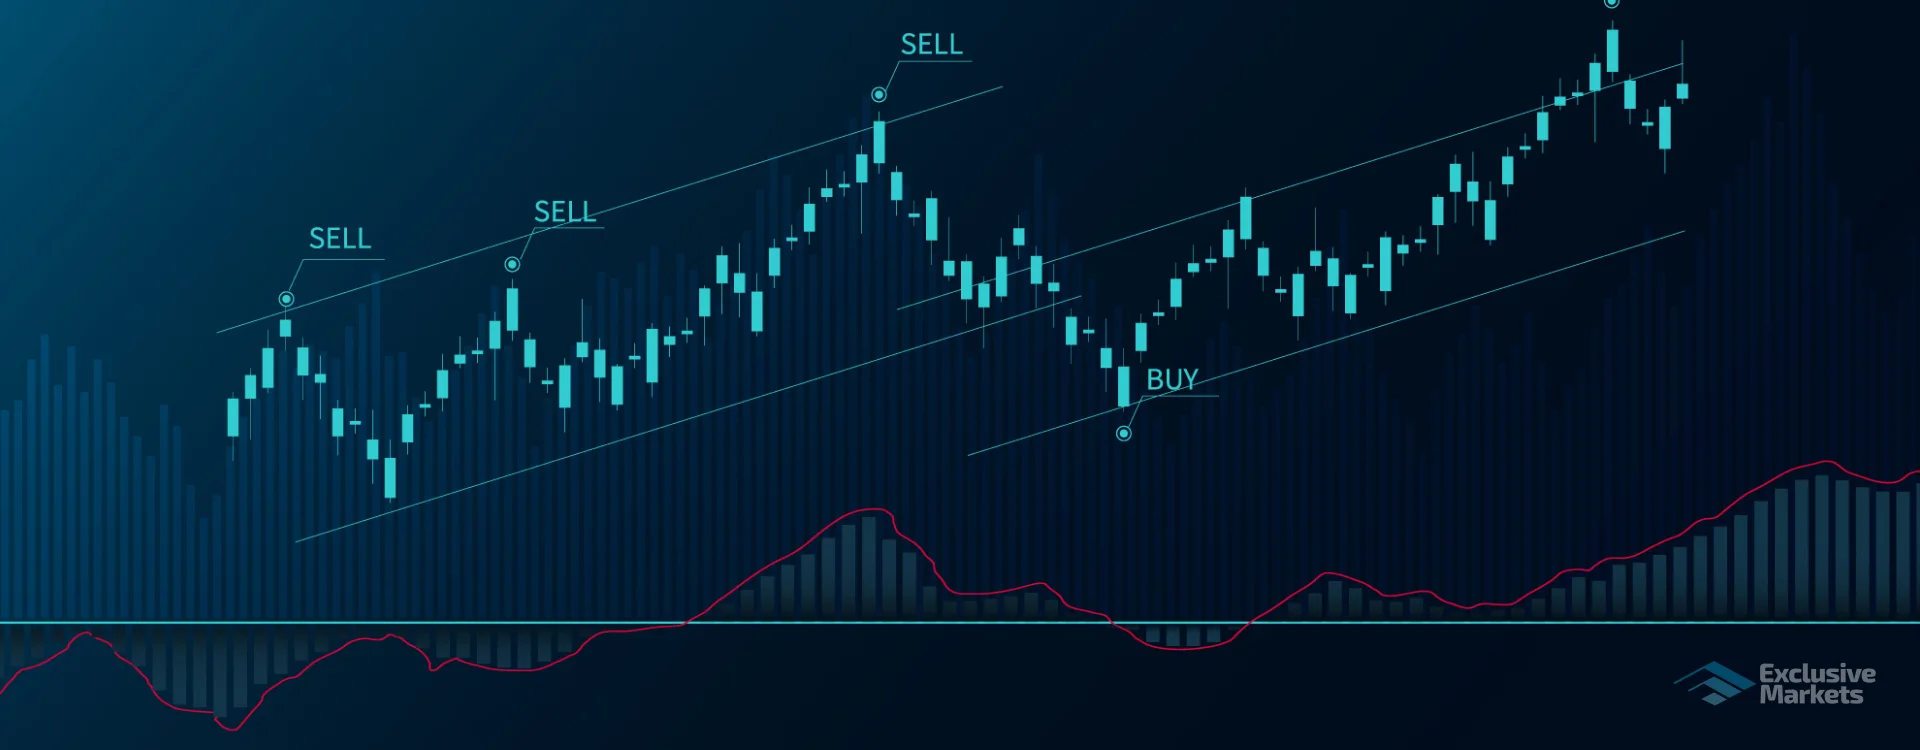
Trend trading is an approach that focuses on identifying and following the market's overall direction, known as the trend. The main idea is that prices often move in identifiable directions over time, and traders aim to align their trades accordingly, though success is never guaranteed.
Trends are typically categorised into three types:
-
Uptrend: If prices are making higher highs and higher lows over time, the market is said to be in an uptrend.
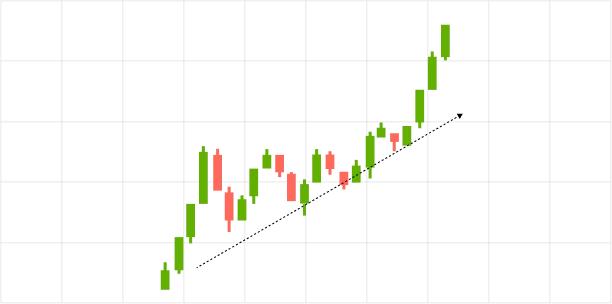
Uptrend -
Downtrend: If prices consistently form lower highs and lower lows, it indicates a downtrend.
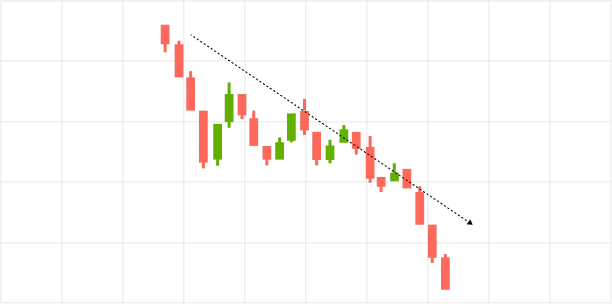
Downtrend -
Sideways: When prices move within a narrow range without a clear direction, it’s known as a sideways or ranging market.
Sideways
Trend traders use various tools such as charts, moving averages, and technical indicators to help identify these movements. The objective is not to predict specific price points, but to interpret general momentum and act accordingly, while remaining aware of the associated risks.
How to Identify a Trend?
Identifying a trend is the first and most crucial step in trend trading.
A trend shows the general direction in which a market or asset is moving over a period of time. Recognising whether the market is trending upward, downward, or sideways may help traders make more structured decisions, though this does not eliminate risk or guarantee successful outcomes.
Here is how you can identify a trend:
-
Look at Price Patterns
One of the most common ways to assess a trend is by observing the price movements on a chart:
- If prices consistently make higher highs, i.e., each peak is higher than the last and higher lows, i.e., each dip is higher than the previous one, then it indicates an uptrend.
For example, imagine a stock starts at $50. Over the next few days, it rises to $55, then $60. During this period, even though the price dips occasionally, the lows are higher than before, i.e., the first dip is at $52, the next at $57.
Because the highs are rising, i.e., $50 to $55 to $60, and the lows are also increasing, i.e., $52 to $57, this pattern may suggest a strong uptrend.
- If the prices form lower highs, i.e., peaks are lower and lower lows, meaning dips fall further, then it is a downtrend.
However, it's important to note that trends can reverse unexpectedly, and patterns alone should not be relied on to make trading decisions.
Now consider another stock starting at $80. Over time, it drops to $75, then $70. The occasional bounce-backs are $77 and $72, which are lower than the previous highs. Since both the highs, i.e., $80 to $77 to $72, and the lows, i.e., $75 to $70, are decreasing, this signals a downtrend.
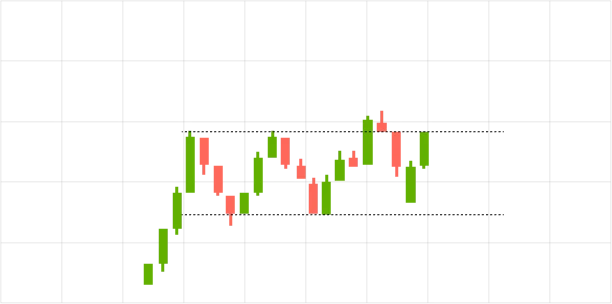
- If the prices move within a horizontal channel, showing no clear upward or downward direction, then it may indicate a sideways or range-bound market.
To understand, say a stock moves between $40 and $45 for several days without forming higher highs or lower lows, it is moving sideways. This shows no clear upward or downward momentum, and traders often wait for a breakout before acting.
-
Use Trendlines
A trendline is a straight line drawn along the higher lows in an uptrend or the lower highs in a downtrend. Connecting these points visually helps traders observe the prevailing market direction, although this method should not be used in isolation when making trading decisions.
- A rising trendline may indicate an uptrend
- A declining trendline may signal a downtrend.
For instance, if a stock’s lows over the last month are $45, $48, and $50, drawing a line through these points shows a rising trendline, which may suggest upward momentum. Conversely, if highs are $60, $57, and $54, a declining trendline indicates a downtrend, which may indicate a potential downtrend.
However, trendlines are not predictive tools and can break at any time. Traders should consider using trendlines in combination with other technical indicators and risk management practices.
-
Moving Averages
Traders often use moving averages to smooth out price fluctuations and help identify potential trends over time:
- A 50-day moving average reflects the average price over the last 50 days.
- If the current price remains above the moving average, it may suggest upward momentum.
- If the price stays below the moving average, it may indicate downward pressure.
Moving averages are lagging indicators. They reflect past price action and should not be interpreted as predictive tools. Trends can reverse unexpectedly.
-
Technical Indicators
Additional indicators such as MACD (Moving Average Convergence Divergence) or RSI (Relative Strength Index) are often used to help assess the strength or momentum of a trend.
For example, if a stock’s RSI is steadily above 50 and rising, it supports an uptrend. If it’s below 50 and declining, it supports a downtrend. Similarly, if the MACD line crosses above the signal line, it may indicate upward momentum, and crossing below may indicate downward momentum.
By combining price patterns, trendlines, moving averages, and momentum indicators, traders can form a more informed view of market direction.
For beginners, starting with basic tools like price patterns and trendlines may offer a simpler entry point into trend identification, before relying on more complex technical indicators.
How to Know When a Trend is Over?
Trends don’t last forever, and markets can reverse or enter sideways movement unexpectedly. Understanding when a trend is weakening or potentially ending is just as important as identifying when it begins.
Identifying possible trend exhaustion can help traders manage risk exposure and make more informed decisions. Below are some commonly used methods to assess whether a trend may be losing momentum:
-
Price Action shows reversal patterns
Certain price formations often indicate that a trend may be losing strength:
- Double Top / Double Bottom: A double top appears in an uptrend when the price reaches a high twice but fails to break higher, signalling potential reversal.
For example: A stock rises to $100, drops to $95, then rises again to $100 but fails to break $100, then begins declining. This may indicate the uptrend may be ending.
- Head and Shoulders Pattern: Typically signals trend reversal, an uptrend forming a peak (head) between two smaller peaks (shoulders) interpreted as a possible signal of a downward move.
-
Moving Average Crosses
Many traders observe moving average crossovers as trend signals. For example, if the 50-day moving average crosses below the 200-day moving average (a death cross), it may suggest the uptrend is ending. Conversely, a short-term moving average crossing above a long-term average (a golden cross) may signal the start of a new uptrend.
-
Declining Momentum Indicators
Momentum indicators like RSI and MACD may indicate weakening strength in a trend. For example, in an uptrend, if the RSI starts falling from above 70 toward 50, it signals that the upward momentum is slowing. If MACD lines start converging or crossing downward, it may indicate the trend is fading.
-
Support and Resistance Levels
A trend may struggle to continue if prices repeatedly fail to break key levels. For example, an uptrend stock repeatedly tests resistance at $120 but cannot close above it. Each failed attempt may suggest the trend is losing momentum and could reverse.
-
Volume Changes
Volume often confirms trends. A trend losing volume may be weakening. For example, if a rising stock is making higher highs but trading volume is decreasing with each peak, it may indicate that buying pressure is fading, signalling a potential trend end.
By observing these signals together, price patterns, moving averages, momentum indicators, support/resistance, and volume, traders may develop a more structured approach to spotting trend endings.
However, no indicator or pattern can predict market movements with certainty. Trend reversals can occur unexpectedly due to economic or geopolitical events.
Different Types of Trend Trading Strategies
Trend trading can be approached in several ways, depending on a trader’s goals, time horizon, and risk tolerance. Understanding the types of trend trading strategies may help beginners select a method that suits their needs.
-
Breakout trading
Breakout trading focuses on entering the market when the price moves beyond a key support or resistance level, which may signal the potential start of a new trend. Traders typically monitor consolidation areas, chart patterns, and horizontal levels to identify potential breakout points.
Once a breakout occurs, traders often look for confirmation through increased volume or volatility. The aim is to capture the early phase of a trend before it becomes broadly recognised.
-
Pullback trading
Pullback trading involves entering a trade during a temporary retracement within a broader trend. Instead of buying at the top or selling at the bottom, traders wait for the price to pull back to certain levels such as moving averages, trendlines, or Fibonacci levels.
This strategy seeks to enter at a more favourable price while remaining aligned with the overall trend direction. Pullback entries do not eliminate risk, and what appears to be a pullback may become a full reversal.
-
Momentum trading
Momentum trading focuses on entering trades when there is strong directional movement, often driven by increased buying or selling activity. Traders typically rely on technical indicators like RSI, MACD, or volume spikes to confirm accelerating momentum.
The goal is to ride the strength of the trend while it lasts, and to exit once signs of weakening or reversal appear. This style of trading can be fast-paced and may involve elevated risk, particularly in volatile markets.
-
Moving average crossover
The moving average crossover strategy uses two or more moving averages to identify potential trend direction and entry signals. A common example is when a shorter-term average (such as the 50-day MA) crosses above a longer-term average (like the 200-day MA), signalling upward trend momentum.
Crossovers are often used to confirm trend shifts or signal the end of a pullback. The method is typically part of a rules-based trading plan and can be applied across multiple timeframes. Like all technical methods, crossovers are based on historical data and are not predictive. Lag and false signals are possible.
Advantages
Trend trading offers several benefits that may appeal to some traders, particularly those looking for a structured approach to analysing market direction:
- Provides a clear framework: By focusing on the market’s directional movement, trend trading offers a systematic approach to decision-making. Rather than reacting impulsively to every fluctuation, traders can follow a structured plan, which may help support more disciplined behaviour.
- Reduces emotional trading: Emotions like fear and greed can affect trading decisions. Trend trading encourages alignment with observed price movements, which can support more objective decision-making.
- Adaptable across markets: Trend trading is not limited to a specific asset class. It can be applied to instruments such as stocks, forex, commodities, and indices, although product-specific risks should always be considered.
- Focuses on broader market moves: By following the prevailing trend, traders aim to align with broader price movements rather than small, short-term fluctuations, though market outcomes remain uncertain. This approach may support more structured positioning, depending on the trader and market conditions.
- Promotes patience and discipline: Trend trading rewards careful observation and waiting for the right opportunities. For beginners, this focus on patience and disciplined entry and exit points can help build strong foundational trading habits.
Limitations
While trend trading offers structure and potential benefits, it also comes with important limitations and risks:
- Late entry or exit: Since trends are more clearly visible in hindsight, traders may enter late or exit too early, which can reduce potential gains.
- False signals: Apparent trends may reverse quickly, particularly in volatile or uncertain markets.
- Sideways markets: Trend trading strategies generally perform poorly when prices are moving within a narrow range without clear direction.
- Requires patience and consistency: Identifying and acting on trends can involve long waiting periods, which may not suit all trading styles.
- No Guarantees: Even well-defined trends can reverse unexpectedly due to market news, economic shifts, or geopolitical events. Losses are always possible, and traders must be prepared for both favourable and adverse outcomes.
Understanding these limitations is essential. A well-informed, risk-aware approach is key to applying trend trading responsibly.
Conclusion
Trend trading can offer a structured way to interpret market direction. By learning how to identify trends, observe possible reversals, and apply risk management practices, traders, including beginners, may be able to make more confident and informed decisions.
While no strategy guarantees results, understanding trends allows traders to align with market momentum and build a solid foundation for their trading journey.
Are you Ready to Explore the World of Trading?
Disclaimer: The information provided on this blog is for educational/informational purposes only and should not be considered financial/investment advice. Trading carries a high level of risk, and you should only trade with capital you can afford to lose. Past performance is not indicative of future results. We do not guarantee the accuracy or completeness of the information presented, and we disclaim all liability for any losses incurred from reliance on this content.