Table of Content
Imagine being able to "read" the market, understanding its mood, and anticipating its next move—sounds like a superpower, right? That’s precisely what candlestick charts can offer you.
Candlestick charts are one of the most widely used tools in technical analysis. They offer a clear and effective way to visualise market data. Traders and investors rely on them to understand price movements and make better-informed decisions. Whether you are a novice or an experienced trader, learning to read and interpret candlestick charts is a valuable skill to support trading efforts.
This blog will explore the history, components, patterns, and best practices for reading candlestick charts. By the end of this article, you will have a solid understanding of how to use these charts as part of your broader forex trading strategy.
History of Candlestick Charts
Candlestick charts, which originated in Japan in the 17th century, were initially used by rice traders in the city of Sakata to track the price movements of rice futures. This technique, known as "Munehisa Homma’s candlestick charting," was developed by Homma, a Japanese rice trader. He discovered that understanding price patterns could help analyse future market movements, a concept that became the foundation for modern candlestick charting.
Over time, the methodology was adapted to other financial markets, becoming a fundamental aspect of technical analysis. Candlestick charts became more widely used in the West during the 20th century, largely thanks to the work of technical analysts like Steve Nison, who popularized the technique in his books.
Candlestick charts provide more detailed information than traditional line charts. They allow traders to see not only the closing price but also the open, high, and low prices within a specified time period. This added depth gives traders a clearer view of market sentiment.
Components of a Candlestick
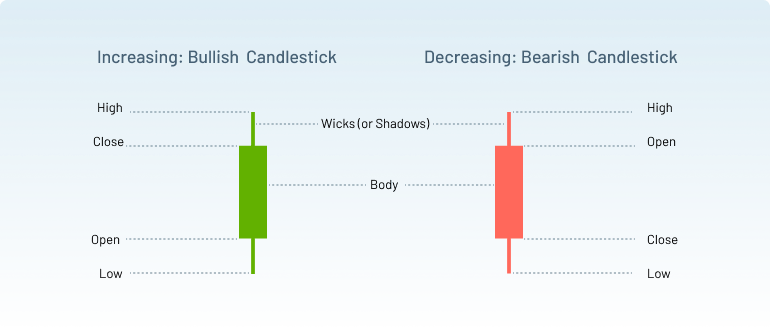
A candlestick represents price action over a specific period, such as 1 minute, 5 minutes, daily, or weekly. Each candlestick comprises several components, which traders use to interpret market behaviour.

- The Body: It is the solid area between open and closed prices. It shows the range between a
specific time-period's opening and closing prices.
- Bullish Candles: A bullish candlestick forms when the closing price exceeds the opening price. It typically appears as a white or green candlestick, indicating upward price movement.
- Bearish Candles: A bearish candlestick forms when the closing price is lower than the opening price. It usually appears as a black or red candlestick, indicating downward price movement.
- Wicks (or Shadows): The wicks, or shadows, extend from the body of the candlestick and
represent the highest and lowest prices reached during the time-period.
- Upper Wick: The upper wick shows the highest price point during the period.
- Lower Wick: The lower wick shows the lowest price point during the period.
Together, the wicks provide insight into the volatility and market sentiment during that time.
- Open and Close Prices: The open price is the first price at which an asset trades during the period, while the close price is the final price at which the asset trades before the period ends. These two prices are critical in determining whether the candlestick is bullish or bearish.
- High and Low Prices: The high and low prices represent the extremes of the trading period. They are crucial to understanding price volatility and market behaviour. The top of the upper wick shows the high price, and the bottom of the lower wick shows the low price.
While candlestick charts are a helpful tool, they do not predict market movements with certainty. Instead, they reflect market sentiment and past price behaviour, which can guide decision-making when used alongside other forms of analysis.
Types of Candlestick Patterns
One or more candlesticks form Candlestick patterns and reflect the psychology of market participants. Some of the most common candlestick patterns include both single and multiple candlesticks.
1. Single Candlestick Patterns
- Doji: A Doji candlestick occurs when the open and close prices are very close, forming a cross-like shape. It signals indecision in the market and often precedes a trend reversal.

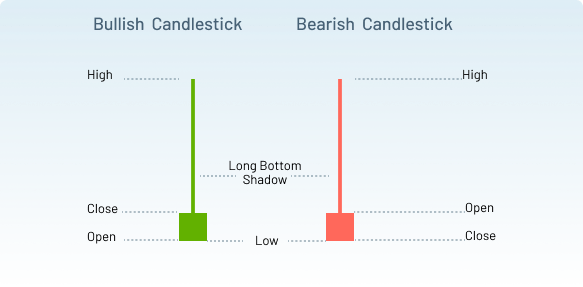
- Hammer: A hammer has a small body near the top of the candlestick, with a long lower wick. It suggests sellers drove prices down, but buyers regained control, often signalling a downtrend reversal.

- Shooting Star: The shooting star has a small body near the bottom of the candlestick, with a long upper wick. It signifies that buyers drove the price up, but sellers took control, often signalling the end of an uptrend.

2. Multiple Candlestick Patterns
- Bullish Engulfing: A bullish engulfing pattern occurs when a small bearish candlestick is followed by a large bullish candlestick that completely engulfs the previous candle. This signals a potential upward reversal.

- Bearish Engulfing: The bearish engulfing pattern is the opposite of the bullish engulfing pattern. It occurs when a small bullish candlestick is followed by a large bearish candlestick, indicating a possible downward reversal.

- Morning Star and Evening Star: These patterns consist of three candlesticks. The morning star pattern indicates a reversal from a downtrend to an uptrend, while the evening star signals a reversal from an uptrend to a downtrend.

3. Market Sentiment
These candlestick patterns give insight into market sentiment. A bullish pattern typically signals optimism, while a bearish pattern suggests fear or uncertainty. Recognising these patterns is essential for understanding potential market movements.
How to Read Candlestick Charts
Reading candlestick charts involves understanding the data presented by the candlesticks and recognising patterns to predict future price movements.
- Setting Up a Candlestick Chart on Trading Platforms: Most trading platforms, such as MetaTrader 4 (MT4) and MetaTrader 5 (MT5), allow traders to set up candlestick charts easily. Select the "Candlestick" chart type from the available options, and you'll be able to view price data in candlestick form.
- Timeframes and Their Implications: Candlestick charts can be viewed in different timeframes, such as 1-minute, 5-minute, hourly, daily, or weekly. The chosen timeframe can impact the interpretation of the chart. For instance, shorter timeframes provide more detailed information about immediate price action, while longer timeframes give an overview of the overall trend.
- Interpreting Trends and Market Movements: Candlestick charts help identify trends by examining the relationship between consecutive candlesticks. A series of consecutive bullish candles indicates an uptrend, while a series of consecutive bearish candles suggests a downtrend. Recognising trends helps traders decide when to enter or exit a trade.
- Using Candlestick Patterns for Trading Decisions: Traders use candlestick chart patterns to anticipate price movements. For instance, a bullish engulfing pattern may prompt a trader to go long, while a shooting star could signal a short opportunity. Combining candlestick patterns with other technical indicators increases the accuracy of trading decisions.
Importance of Candlestick Charts in Technical Analysis
Candlestick charts play a vital role in technical analysis. They offer a visual representation of price action and help traders understand market psychology.
- Integration with Other Technical Indicators: Candlestick charts are often used with other forex technical indicators, such as moving averages and the Relative Strength Index (RSI). Moving averages help confirm trends, while RSI signals overbought or oversold conditions. By integrating these indicators, traders can develop more reliable trading strategies.
- Enhancing Predictive Capabilities: Candlestick charts enhance a trader's ability to predict market movements. By recognising patterns and understanding market sentiment, traders can make better-informed decisions and improve their chances of success.
- Risk Management and Entry/Exit Strategies: Candlestick charts help traders develop effective forex risk management strategies. By analysing price action, traders can set stop-loss orders, determine entry and exit points, and manage risk more effectively.
Common Mistakes to Avoid
While candlestick charts are powerful tools, there are common mistakes that traders should avoid.
- Overly Relying on Candlestick Patterns: While candlestick chart patterns are valuable, they should not be the sole basis for trading decisions. It is recommended to use candlestick patterns with other indicators, and analysis techniques to confirm your choices.
- Ignoring Market Context: Candlestick patterns should always be interpreted within the context of the overall market conditions. A pattern that suggests a reversal in one context may not hold in another.
- Lack of Confirmation from Other Indicators: Never rely on candlestick patterns alone. Before making trading decisions, always seek confirmation from other technical indicators, such as trendlines, moving averages, or RSI.
Conclusion
Candlestick charts are essential for traders and investors, offering a detailed view of market sentiment and price movements. By understanding the components of a candlestick, recognising patterns, and interpreting trends, traders can make more better-informed decisions while managing risks effectively.
Trading involves significant risks, and past performance does not guarantee future results. Practices and careful analysis are key to improving your understanding of the markets. Exclusive Markets provides a platform to practice and refine your strategies—explore it today and take the next step in your trading journey.
Are you Ready to Explore the World of Trading?
Disclaimer: The information provided on this blog is for educational/informational purposes only and should not be considered financial/investment advice. Trading carries a high level of risk, and you should only trade with capital you can afford to lose. Past performance is not indicative of future results. We do not guarantee the accuracy or completeness of the information presented, and we disclaim all liability for any losses incurred from reliance on this content.

 2576
2576 06-03-2025